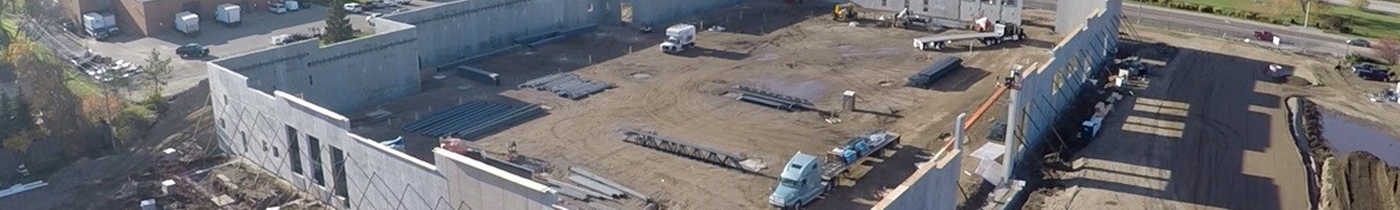
Forest Lake
Population
Back To Top
Back To Top
Population
| Population | 2000 | 2010 | 2025 | 2030 |
|---|---|---|---|---|
| Forest Lake | 14,440 | 18,375 | 20,605 | 21,535 |
Source: ESRI, 2025-10-16
Population by Age
| Population | 2025 |
|---|---|
| 0-4 | 1,142 |
| 5-9 | 1,217 |
| 10-14 | 1,373 |
| 15-19 | 1,418 |
| 20-24 | 1,255 |
| 25-29 | 1,241 |
| 30-34 | 1,297 |
| 35-39 | 1,403 |
| 40-44 | 1,430 |
| 45-49 | 1,232 |
| 50-54 | 1,310 |
| 55-59 | 1,329 |
| 60-64 | 1,227 |
| 65-69 | 1,156 |
| 70-74 | 932 |
| 75-79 | 792 |
| 80-84 | 463 |
| 85+ | 388 |
| 18+ | 15,969 |
| Median Age | 40 |
Source: ESRI, 2025-10-16
Population by Race
| Forest Lake | 2025 |
|---|---|
| Total | 20,605.00 |
| White Alone | 86.77% |
| Black Alone | 1.99% |
| American Indian Alone | 0.46% |
| Asian Alone | 3.18% |
| Pacific Islander Alone | 0.02% |
| Some Other Race | 1.33% |
| Two or More Races | 6.25% |
| Hispanic Origin | 4.44% |
| Diversity Index | 30.60 |
Source: ESRI, 2025-10-16
Growth Rate
| Forest Lake | 2025 - 2030 |
|---|---|
| Population | 0.89% |
| Households | 1.19% |
| Families | 1.03% |
| Median Household Income | 2% |
| Per Capita Income | 2% |
Source: ESRI, 2025-10-16
Housing
Back To Top
Households
| Population | 2000 | 2010 | 2025 | 2030 |
|---|---|---|---|---|
| Households | 5,433 | 7,014 | 8,396 | 8,907 |
| Housing Units | 5,613 | 7,508 | 8,805 | 9,367 |
| Owner Occupied Units | 5,913 | 6,356 | ||
| Renter Occupied Units | 2,483 | 2,551 | ||
| Vacant Units | 409 | 460 |
Source: ESRI, 2025-10-16
Home Value
| Forest Lake | 2025 | 2030 |
|---|---|---|
| Median Home Value | $459,442 | $506,143 |
| Average Home Value | $493,909 | $541,636 |
| <$50,000 | 161 | 141 |
| $50,000 - $99,999 | 20 | 8 |
| $100,000 - $149,999 | 63 | 18 |
| $150,000 - $199,999 | 90 | 50 |
| $200,000 - $249,999 | 312 | 226 |
| $250,000 - $299,999 | 376 | 246 |
| $300,000 - $399,999 | 1,135 | 851 |
| $400,000 - $499,999 | 1,345 | 1,582 |
| $500,000 - $749,999 | 1,693 | 2,279 |
| $1,000,000 + | 55 | 72 |
Source: ESRI, 2025-10-16
Housing Year Built
| Year Range | Houses Built |
|---|---|
| 2010 or Later | 1,096 |
| 2000-2009 | 1,896 |
| 1990-1999 | 1,156 |
| 1980-1989 | 1,053 |
| 1970-1979 | 1,323 |
| 1960-1969 | 634 |
| 1950-1959 | 577 |
| 1940-1949 | 163 |
| 1939 or Before | 588 |
Source: ESRI, 2025-10-16
Back To TopIncome
Back To Top
Income
| Forest Lake | 2025 | 2030 |
|---|---|---|
| Median Household | $97,397 | $105,357 |
| Average Household | $122,137 | $132,651 |
| Per Capita | $49,784 | $54,881 |
Source: ESRI, 2025-10-16
Household Income
| Forest Lake | 2025 |
|---|---|
| <$15,000 | 278 |
| $15,000 - $24,999 | 224 |
| $25,000 - $34,999 | 512 |
| $35,000 - $49,999 | 870 |
| $50,000 - $74,999 | 1,194 |
| $75,000 - $99,999 | 1,219 |
| $100,000 - $149,999 | 1,936 |
| $150,000 - $199,999 | 1,025 |
| $200,000+ | 1,138 |
Source: ESRI, 2025-10-16
Back To TopEmployees
Back To Top
Commute
| Category | Commuters |
|---|---|
| Workers 16+ | 10,894 |
| In-County Residents | 5,410 |
| Out-of-County Residents | 5,320 |
| Drive Alone | 7,954 |
| Carpooled | 825 |
| Public Transport | 2 |
| Work at Home | 1,755 |
| Motorcycle | 42 |
| Bicycle | 35 |
| Walked | 281 |
| Other | 0 |
| Less than 5 minutes | 508 |
| 5-9 minutes | 1,040 |
| 10-14 minutes | 1,163 |
| 15-19 minutes | 967 |
| 20-24 minutes | 570 |
| 25-29 minutes | 852 |
| 30-34 minutes | 1,486 |
| 35-39 minutes | 568 |
| 40-44 minutes | 664 |
| 45-59 minutes | 886 |
| 60-89 minutes | 357 |
| 90+ minutes | 78 |
| Average Travel Time | 25 |
Source: ESRI, 2025-10-16
Source: ESRI, 2025-10-16
Employees by NAICS
| Category | Number |
|---|---|
| Total Employees | 8,843 |
| Agr/Forestry/Fish/Hunt | 5 |
| Mining | 5 |
| Utilities | 0 |
| Construction | 443 |
| Manufacturing | 746 |
| Wholesale Trade | 75 |
| Retail Trade | 2,195 |
| Motor Veh/Parts Dealers | 516 |
| Furn & Home Furnish Str | 23 |
| Electronics & Appl Store | 4 |
| Bldg Matl/Garden Equip | 393 |
| Food & Beverage Stores | 277 |
| Health/Pers Care Stores | 109 |
| Gasoline Stations | 7 |
| Clothing/Accessory Store | 17 |
| Sports/Hobby/Book/Music | 191 |
| General Merchandise Str | 658 |
| Transportation/Warehouse | 202 |
| Information | 103 |
| Finance & Insurance | 337 |
| Cntrl Bank/Crdt Intrmdtn | 146 |
| Sec/Cmdty Cntrct/Oth Inv | 93 |
| Insur/Funds/Trusts/Other | 98 |
| Real Estate/Rent/Leasing | 414 |
| Prof/Scientific/Tech Srv | 375 |
| Legal Services | 223 |
| Mgmt of Comp/Enterprises | 10 |
| Admin/Support/Waste Mgmt | 183 |
| Educational Services | 831 |
| HealthCare/Social Assist | 939 |
| Arts/Entertainment/Rec | 160 |
| Accommodation/Food Srvcs | 866 |
| Accommodation | 41 |
| Food Srv/Drinking Places | 825 |
| Other Srv excl Pub Admin | 684 |
| Auto Repair/Maintenance | 148 |
| Public Administration Emp | 270 |
Source: ESRI, 2025-10-16
Educational Attainment (25+)
| Forest Lake | 2025 |
|---|---|
| <9th Grade | 199 |
| Some High School | 627 |
| GED | 311 |
| Graduated High School | 3,355 |
| Some College/No Degree | 2,709 |
| Associates Degree | 1,776 |
| Bachelor's Degree | 3,671 |
| Graduate Degree | 1,552 |
Source: ESRI, 2025-10-16
Back To TopBusinesses
Back To Top
Businesses by NAICS
| Category | Number |
|---|---|
| Total Businesses | 747 |
| Agr/Forestry/Fish/Hunt Bus | 2 |
| Mining Bus | 1 |
| Utilities Bus | 0 |
| Construction Bus | 57 |
| Manufacturing Bus | 33 |
| Wholesale Trade Bus | 14 |
| Retail Trade Bus | 112 |
| Motor Veh/Parts Dealers Bus | 29 |
| Furn & Home Furnish Str Bus | 7 |
| Electronics & Appl Store Bus | 2 |
| Bldg Matl/Garden Equip Bus | 16 |
| Food & Beverage Stores Bus | 14 |
| Health/Pers Care Stores Bus | 14 |
| Gasoline Stations Bus | 1 |
| Clothing/Accessory Store Bus | 5 |
| Sports/Hobby/Book/Music Bus | 16 |
| General Merchandise Str Bus | 8 |
| Transportation/Warehouse Bus | 11 |
| Information Bus | 18 |
| Finance & Insurance Bus | 64 |
| Cntrl Bank/Crdt Intrmdtn Bus | 19 |
| Sec/Cmdty Cntrct/Oth Inv Bus | 21 |
| Insur/Funds/Trusts/Other Bus | 24 |
| Real Estate/Rent/Leasing Bus | 58 |
| Prof/Scientific/Tech Srv Bus | 54 |
| Legal Services Bus | 15 |
| Mgmt of Comp/Enterprises Bus | 2 |
| Admin/Support/Waste Mgmt Bus | 16 |
| Educational Services Bus | 21 |
| HealthCare/Social Assist Bus | 60 |
| Arts/Entertainment/Rec Bus | 15 |
| Accommodation/Food Srvcs Bus | 53 |
| Accommodation Bus | 5 |
| Food Srv/Drinking Places Bus | 48 |
| Other Srv excl Pub Admin Bus | 114 |
| Auto Repair/Maintenance Bus | 28 |
| Public Administration Bus | 19 |
Source: ESRI, 2025-10-16
Back To Top